
Essential IG Stats (2026): Instagram Statistics for your Business
Instagram now has 2 billion monthly active users and 500 million daily active users worldwide. If your business isn’t taking advantage of this, you’re likely missing out on thousands of potential customers. These Instagram statistics aren’t just numbers, they’re signposts for smarter marketing.
Why should your business care about Instagram statistics?
Understanding Instagram statistics helps you analyse Instagram performance, track important metrics, and identify what actually works. Whether you’re running two accounts, looking to view insights, or trying to reach your target audience, keeping an eye on IG stats is one of the easiest ways to quickly assess your content type, engagement rate, and more. It’s about making smarter choices with the data right in front of you.
What do the general Instagram statistics tell us?
Instagram has a total number of 2 billion monthly active users globally and 500 million daily active users as of mid‑2025
If you’re not creating content for your Instagram account, your competitors likely are. It’s one of the largest pools of potential customers you can access, especially when paired with official Instagram API data and account statistics tools. (Source)
It remains the third‑most popular social media platform worldwide, tied with WhatsApp
That ranking isn’t just for show. It tells you that people trust and use the platform regularly. Whether it’s watching Stories, liking videos, or sharing posts with other accounts, users are actively engaging. For SMEs, this means higher odds of being seen and remembered, if you play your cards right. (Source)
Instagram’s ad reach touched 1.74 billion users globally
Advertising on Instagram isn’t just a nice-to-have anymore. With that kind of reach, even niche Instagram accounts can connect with massive audiences. If you’re running ads, it’s essential to use Instagram analytics to measure what works. Focus on content type, performance, and engagement. (Source)
In the UK, there were 34.71 million Instagram users (~50.1 % of the population) as of February 2025
Nearly half the UK is on Instagram. That includes your customers, competitors, and potential partners. Whether you’re in retail, services, or tech, using Instagram statistics to monitor trends and track analytics is key. (Source)
4 of the 5 most liked posts on Instagram feature Lionel Messi. (Not including reels)
In order:
5th. Messi sat with the World Cup trophy on a plane – 41,193,055 likes
4th. Ronaldo and Messi playing chess for Louis Vuitton campaign – 41,660,095 likes
3rd. Messi sleeping beside the World Cup trophy – 53,743,521 likes
2nd. The World Record Egg by Chris Godfrey – 60,564,040 likes
1st. Messi celebrating Argentina’s World Cup victory in 2022 – 74,550,283 likes
While SMEs aren’t likely to be featuring Messi on their own accounts, it does show that the more authentic a post feels, the better is likely to perform – evidenced by the outcry of people liking a stock photo of an egg… (Source)
How are people actually using Instagram?
The average time spent on Instagram per user is over 33 minutes per day
Think of this as a 33-minute window where you can show up in someone’s feed. That could be your latest video, Story, carousel, or post. Make those minutes count by posting regularly and analysing how people engage with all the posts. (Source)
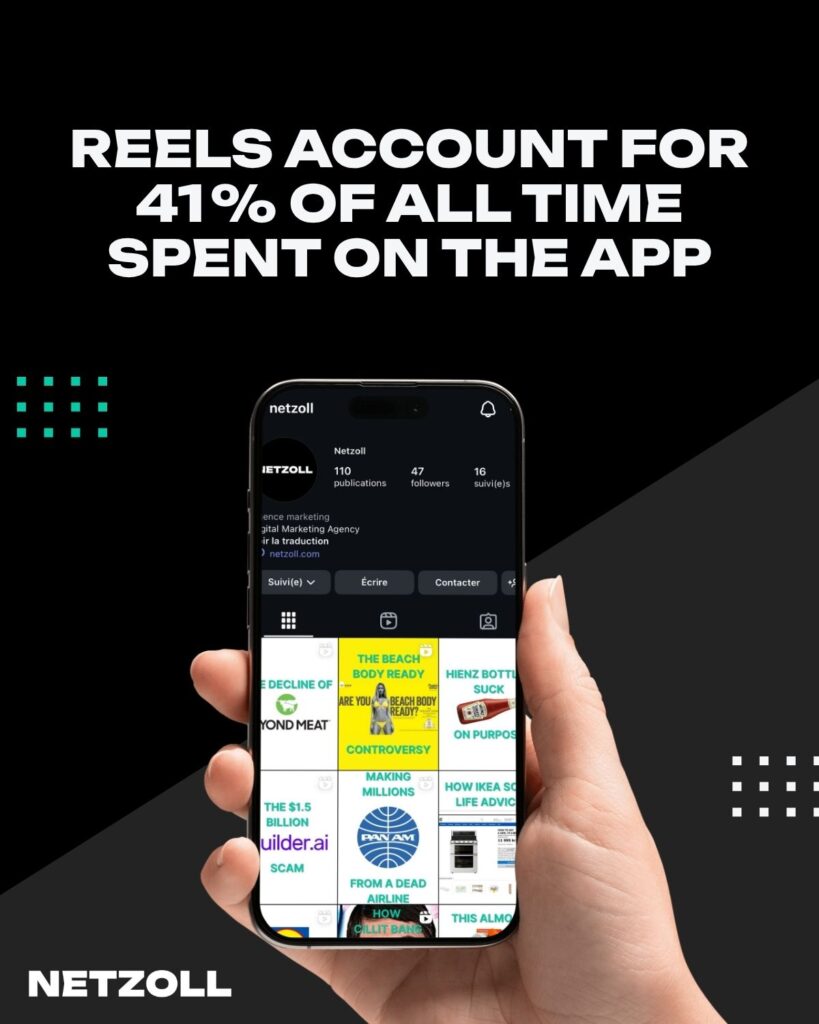
Reels account for 41 % of all time spent on the app as of mid‑2025
If you’re not using Reels, you’re giving away nearly half the screen time. Short-form video content is dominating. Keep an eye on Instagram stats for each post to see what performs best and use tools to monitoring their success. (Source)
50% of users interact with brands on Instagram
This is your sign to make your Instagram profile feel like a place people want to interact with. Ask questions, respond to comments, use the search bar to find trending hashtags, and build trust. (Source)
Carousels now outperform Reels, with an engagement rate of 0.55 %
Don’t ditch static or carousel posts just yet. If Reels get you reach, carousels keep users engaged. Use a mix. Then analyse Instagram performance using account statistics to find the sweet spot for your audience. (Source)
Who are the users behind the stats?
49.4 % female, 50.6 % male globally on Instagram
The platform is nearly balanced, so your content should be too. Test different angles and use analytics to learn what speaks to your target audience best. (Source)
62.3 % of users are aged 18–34
This is prime spending power. If your Instagram account isn’t appealing to millennials or Gen Z, you’re missing the mark. Use clear CTAs, trendy hashtags, and eye-catching visuals. (Source)
Gen Z and millennials make up the majority of Instagram’s user base
These users love stories, memes, behind-the-scenes content, and quick access to information. Provide value in a way that feels authentic and human. (Source)
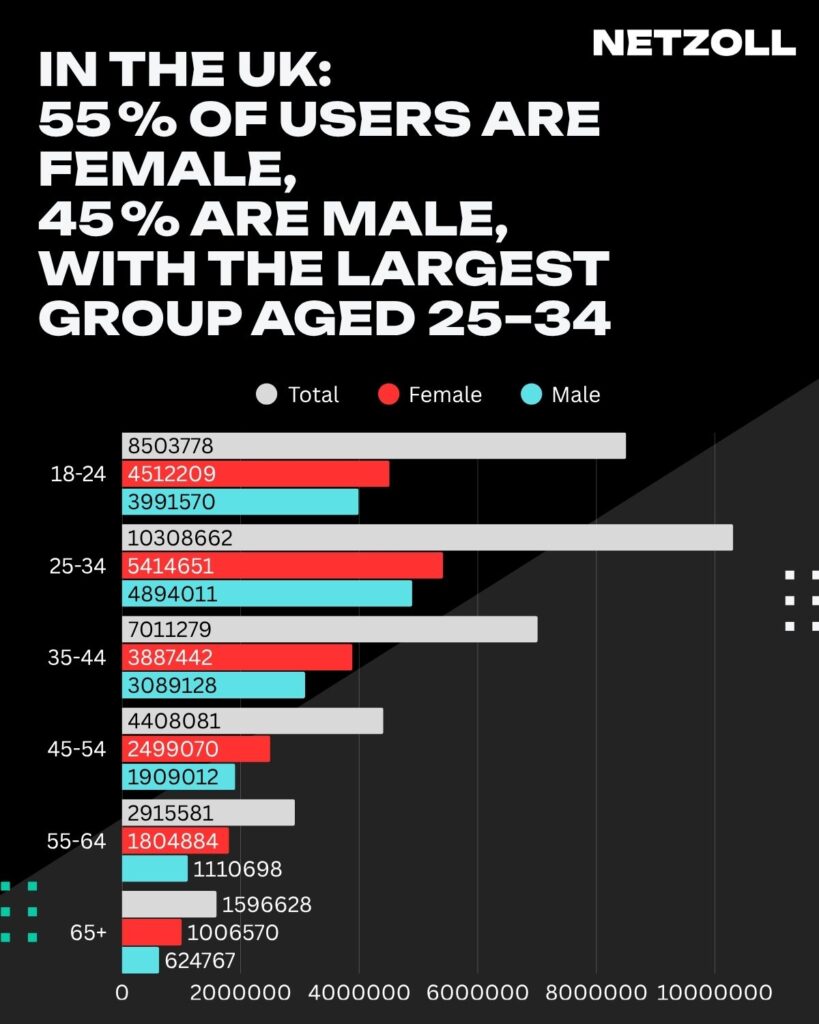
In the UK: 55 % of users are female, 45 % are male, with the largest group aged 25–34
Think of this when planning your campaigns. Use Instagram’s built in data statistics to test different styles and tone. Look at your insights, especially for age and gender breakdowns. Alternatively use third party apps for more detailed reports and tracking analysis. (Source)
What can we learn from Instagram Reels data?
Over 2 billion users engage with Reels monthly
The demand is huge. Reels are no longer optional. Use them to showcase behind-the-scenes moments, product features, or FAQs. (Source)
200 billion Reels are viewed daily
Think about how that volume affects discoverability. Use clear hooks, relevant hashtags, and eye-catching captions. (Source)
Reels generate 22 % more interaction than standard video posts
Viewers don’t just watch Reels, they actively engage with them by liking, saving, and sharing. This makes them a valuable format for boosting your engagement rate. (Source)
Keep track of performance using Instagram Insights or an analysis tool that lets you export your account statistics in CSV exports or PDF format. This way, you can quickly assess which Reels drive the most interaction and refine your content strategy based on clear data.
Reels get 1.36× more reach than carousels, but only 20.7 % of creators post them
Here’s your chance to stand out. Fewer creators mean less competition. If you’re one of the few creating quality Reels, you’ll be rewarded in reach and engagement rate. (Source)
What’s happening with Meta/Instagram Ads?
Instagram’s global ad revenue is projected at $67.27 billion in 2025
That’s a sign that businesses are betting big on Instagram. But don’t just spend, track results and use the official Instagram API or third-party tools to improve performance. (Source)
Instagram Reels ads generate 27 % higher engagement compared to static feed ads
Reels aren’t just good for organic reach. If you’re running ads, test out Reels-specific formats and see how your metrics compare. (Source)
Meta’s AI tools have increased Instagram ad conversions by ~5 % in Q2 2025
This means your ads are likely more effective with less manual work. Use automation and AI suggestions, but still check your account performance weekly. (Source)
Cost per click dropped by 10 %, while clicks climbed 14 % year-over-year
More clicks for less money? That’s a good time to invest. Just make sure your landing page or Instagram profile is optimised for conversions. (Source)
What marketing trends do the latest Instagram statistics reveal?
29 % of users make purchases directly on Instagram
If you’re not using product tags or a Shop page, now’s the time. Make it easy to track purchases and analyse Instagram sales funnels. (Source)
40.1 % of Instagram shoppers spend over $200 per year
That’s high purchase intent. Focus on storytelling and product education to build trust before the sale. (Source)
70 % of shoppers use Instagram to discover or buy products
Your posts, Stories, Reels and even your username play a role in this. Make your Instagram account clear, professional, and useful. (Source)
Product-tagged feed ads see about a 38 % higher checkout rate than those without shopping features
Adding product tags to feed ads makes it easier for people to buy in just a few taps. This smoother shopping journey removes friction, encourages quick purchases, and increases the chances of turning interest into sales. (Source)
How is influencer marketing evolving in 2025?
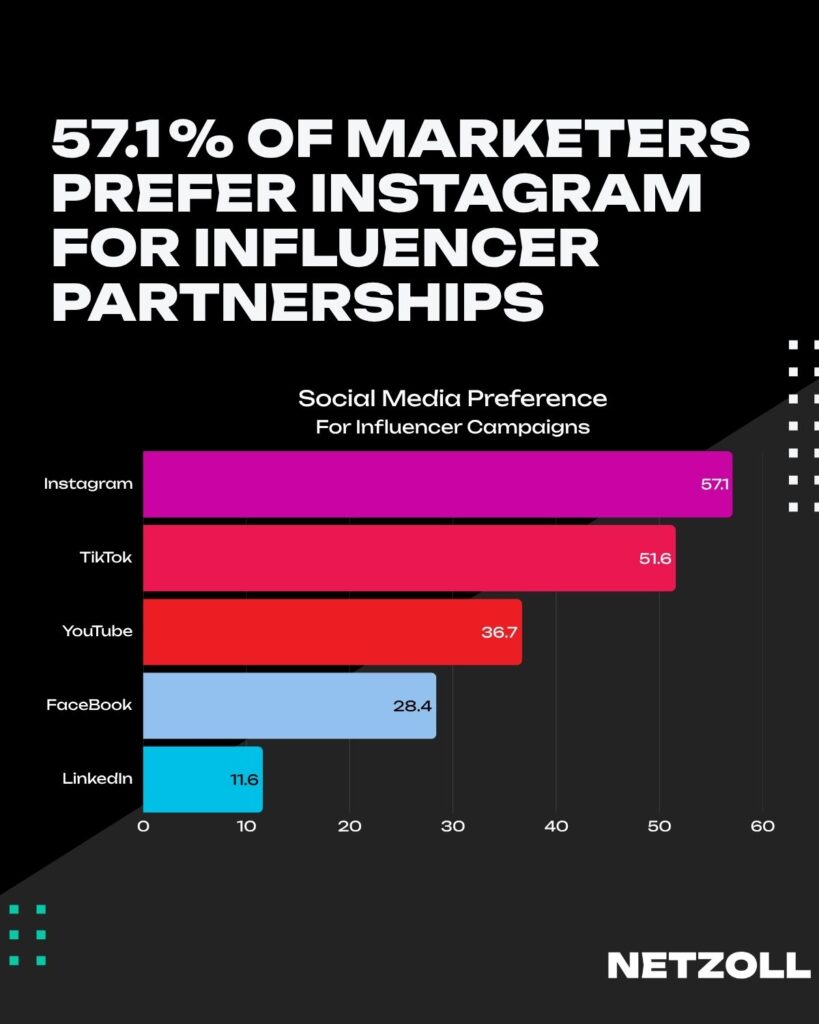
57.1 % of marketers prefer Instagram for influencer partnerships
That’s more than TikTok or YouTube. Find creators who match your brand voice and track their impact with account statistics and engagement rate. (Source)
Total influencer marketing market expected to reach $32.55 billion in 2025
That’s a huge ecosystem. Whether you’re paying with cash or gifting products, make sure to analyse Instagram performance and demand deliverables. (Source)
87 % of influencers use Instagram to collaborate with brands
That means creators are ready to work with you. Focus on mutual value, don’t just look at their follower count, but their post performance. (Source)
Brands earn $4.12 for every $1 spent on Instagram influencer campaigns
The ROI is there. Use tools to track results, from promo codes to affiliate links, and build long-term relationships with the right influencers. (Source)
What are businesses doing on Instagram?
Over 200 million business profiles are active on Instagram worldwide
You’re not alone, but most businesses don’t make the most of their data. Use Instagram Insights to monitoring growth and test new strategies. (Source)
72% of Gen Z prefer Instagram for customer care
That’s huge. Don’t leave your DMs unread. Use Stories and Q&A tools to respond quickly. (Source)
The average Instagram Business Account posts once per day
Consistency is key. Posting once daily can improve visibility and help you reach new followers via the search bar and Explore. (Source)
Creator-generated media revenue (including Instagram) is projected to hit $184.9 billion in 2025 globally
That means content creators are shaping buying behaviour. Tap into this by reposting UGC, collaborating with creators, and engaging with comments regularly. (Source)
What should you take away from all these Instagram statistics?
Instagram is still growing, still evolving, and still one of the best places for UK businesses to reach their audience. Whether you manage two accounts or one, use these Instagram stats to shape your strategy. Don’t guess, analyse, track, and adapt. Your next customer could be one scroll away.
Want to turn these Instagram statistics into real growth? Contact Netzoll today and let’s boost your engagement, sales, and brand visibility.